
Over the last three months or so I had the pleasure of working with the talented team of blackbox.vc (http://blackbox.vc/) on the startup genome project (SG).
The goal of the project is extremely ambitious - to map, model and analyze what makes startups tick, what helps them succeed and why many of them fail. We are hoping that the insights generated through this project will create useful tools for increasing success rates of startups during their initial growth periods, as well as will shed light on interesting phenomena, pitfalls to avoid and much more.
My part in this project was to aid with the technical and scientific analysis of the data, anywhere from initial definitions of the questions to be answered up to giving input on what conclusions can be drawn using different statistical techniques. An academic marketing background is excellent for this purpose, as it brings in tools from survey design, econometrics, some psychology and more.
 |
| [Source: 12manage.com] |
The process was fun (and is still going on), but initial results will appear any day now first report we publish. One interesting conclusion is that many firms today, especially young startups, own hordes of data they are not sure how to handle. This is similar to a person striking an oil field, but without any refining technology in sight to turn oil into usable fuel. The firms sit on gold (or oil) in the form of data, but cannot tap into this resource because of uncertainty on how to attack such a problem.
I think there is a lot to be learned from how we analyzed the data and the methodological process that happened while writing our report, and this post is aimed at telling the story. If there is any specific part or topic which you are interested in, leave a comment in the comments section, or contact me, and I'll do my best to elaborate more. If you're interested in future updates, just follow me on Twitter.
As in any genome project (as if I was ever part of one), there are three main parts to this project:
- Mapping - Initially, we were first tasked with a simple question - we had lots of data, some of it good, some bad, some accurate, some not - what is there that is useful?
- Modeling and Hypothesizing - Once we had a better grasp of the data we had in our hands, we needed a way to think about the questions we would like to answer. In order to ask smart questions, we needed a simple way to describe the process startups go through, if they go through a standard one at all.
- Analysis and Reporting - Given a model and the data, we set upon checking our hypotheses and drawing conclusions from the validated ones. We ended up with tons of numbers, tables, graphs, equations and what not. The final goal was to somehow synthesize it all into readable content, which is also (hopefully) actionable.
Mapping and exploring Data
The initial survey created by Max and Bjoern and the rest of the StartupGenome team was exploratory in nature. It contained a long list of questions covering many areas that can describe a startup to an outside observer.
In more formal language, the survey took a static view of the world and tried to capture a snapshot of a startup's developmental stage using a list of questions. The team had understood that a static view will probably provide very limited actionable information for startups, since the current stage of a startup does not contain all of its historical information. We had, however, to start somewhere.
The goal of the survey was to give us enough information to formulate a model that we can later focus on and test in future surveys. The future surveys are planned to take a more dynamic view of startup development. Although the SG team had an initial model in mind, it was still unclear if the model is correct, and what the answers to the questions would look like.
The first thing we had to do, given survey answers, was to describe them in a succinct and parsimonious manner. (On a side note, did you ever notice how people like to use "parsimonious" to say "simple" in a non-simple manner?).
The result of describing the data is called "descriptive statistics". The typical descriptive statistics are averages, standard deviations and counts of various aspects of the data. In our process we created a huge amount of different cuts, views, cross tabulations, graphs, means and statistical significance tests to check relationships and correlations in our data. Once we had those, we leaned back, looked at them from afar and tried to ask ourselves "do these results make sense".
The sanity check stage was very important, it showed us where we had inaccuracies and other problems in the data, where the people who answered the survey may have misunderstood the questions, and also where initial correlations show a promising direction for deeper research.
An interesting question was what tool to use to perform data analysis. As uncool as it may be, I still believe Microsoft Excel (yes, even the Mac version) is by far the most powerful tool to work with with raw data if the amount is not too large (up to 1 million rows of data or so).
It lets you easily filter, change, transform, graph, cross tabulate and do many other tasks very simply.
Another option would have probably been using SPSS for that manner.
Google spreadsheets is getting there, but until a week ago had no pivot table support, which was our main tool for generating insights and reports.
Some interesting things we noticed in this process were:
- There was a lot of useful information that could be gleaned even from the simple descriptive statistics. When we showed it to outsiders, the typical response was "wow, that is something I wish I had known before".
- Some of the survey questions could have been answered in several different ways for the same answer. The main reason was the different startups viewed their market potential, and potential customers in a subjective manner which can be interpreted in different ways. This gave rise to the concept of a startup "Type" which says that startups belong to underlying families. Startups within a family seem similar, but they behave very differently across families. This is one of the main themes in our initial report.
- It is very hard to tell from a static snapshot of a startup whether it is successful or not. That is, even given all of the details about the founders, their current stage, whether they raised funding and whether their product looks like it has a good fit with the market, it is still hard to differentiate a winning from a struggling startup without knowing more of how it evolves over time. One conclusion is that the current investment process in startups is done "half blindly" because of the tendency to do a static analysis.
Modeling
Once we had our descriptive statistics, we wanted to start and see if we can tell which startups face more difficulties than others, and whether we can create measures that startups can use to benchmark themselves against best practices.
I remember that in our first day of working on the data, Max had a pretty solid understanding of the stages model and what is the current common knowledge in industry about what stages startups go through, and how. I served as a sort of "devil's advocate" and "question guy", constantly asking questions about the model, and whether answers from the surveys could be interpreted as a one-to-one matching to the different stages in the model. Another thing that had to be done was transform the abstract stages model into something mathematical, or something measurable. Markov chains came as a natural model, and more on them is described later.
We then looked for questions in the data that will identify a stage. Identification (in the academic sense) has a very specific meaning, but intuitively, it says that a specific piece of observed answer or data can only mean a specific value of some unobserved information.
To put things more concretely, in our case the observed data are the answers to questions to the survey, and the unobserved information is the stage a company is in.
Here's an illustrative example (but it's not exactly what we did):
When firms were supposedly in stage 3 or above in the SG model (known as the Efficiency stage), they were supposed to have already achieved a fit between their product and their market, and were also supposed to scale their sales and marketing by pouring money into it.
As a result, we used to questions analyzing the product/market fit and marketing expenditures to determine whether a startup was in stage 3.
We performed this process for every stage in the model, and for each startup we had a Yes/No answer to whether they passed through each of the stage.
We also calculated a "score" for each firm, depending on its recorded answers and clustered firms according to similar score areas, and hence received the aforementioned startup "Personality Types".
Suddenly, we had a serendipitous moment.
We noticed some startups didn't go through all of the stages (according to their answers). We called these startups "inconsistent" and went to their detailed answers to see what inconsistency means. We found out that inconsistent startups were much more likely to lag behind and face difficulties in their developments. Inconsistency looked like a good predictor (or correlator) with a struggling startup.
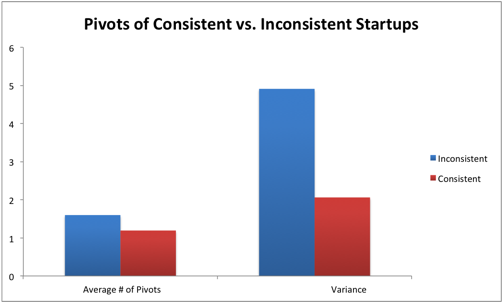 |
| [Source: StartupGenome Report] |
This was an initial indication that the stages model makes sense as a view of the world.
The second thing we did regarding our modeling is assuming our stages model is correct. As a result, we received a model where a (consistent) firm can only move from one stage to the other sequentially. The entire model can then be seen as a Markovian process, or specifically, a POMDP.
If I were to explain what a POMDP is in one paragraph, think of a person making decisions which you observe, but you do not observe the underlying information the person has. Since the person uses the unobserved information to make decisions, one cannot analyze the chain of decisions at face value, but rather needs to have a "belief" about what the decision maker knows and does not know. If we then assume that startups of the same personality type are similar (homogeneous), we can assume the date we observe in the world is an equilibrium of sorts of a process for generating startups and having them move through stages.
All this babble mean we can treat the data for different startups in the same type as if it was almost the same startup in different stages, and reach some nice conclusions.
To simplify things, however, we just assumed we "know" the underlying stage (given the answers to survey questions), and tried to see what actions carried on by entrepreneurs help them move through actions.
Actions, as an example, can be hiring employees, pivoting more, raising money, consulting mentors and more. They do not indicate the stage of a startup (in our model), but can help a startup advance in its stage.
The technical method we used to estimate this model is a "simple" ordered probit, where firms generate "value" which is then converted to a stage by an outside observer. The software (for the geeky oriented) was Stata.
Our initial results seem promising and will be published once we formulate their presentation style (they are complex to read) and also finish all of the statistical testing.
In many of my previous encounters with big data analysis projects, both in my VC years as well as in other positions, I noticed that most people stop after step 1, some continue to step 2, and almost no one does the important job - that of step 3.
Step 1 and 2 are descriptive steps - they tell us how the world behaves and what it looks like. It is interesting, and as people, we love reading graphs, seeing statistics and digesting information.
The reason (and this is purely a conjecture of mine) is that as people, we do not like uncertainty, and statistics brings some order to how we grasp the world.
The main question, I think, is what you do with the statistics and the data. The goal is to provide actionable results for startups, and although we have initial results, we still have a lot of work to do.
The analysis step is (in my opinion) where the true creativity of the team will come out. What we do is first take a step back, and look at the results. We analyze if they make sense and what they mean.
Then we ask a simple question: "What would happen if we actively changed something, or did some action". To test this, we can run a survey, perform an experiment, or run a simulation assuming our model is correct.
I guess our next step with the project is to focus more and more on the modeling and analysis phases, until we will reach the exciting conclusions we aim for.
If you've reached this far down the post, I hope you enjoyed it. As a summary, just remember that every data analysis task, as daunting as it may look has only 3 typical steps, and that the best results, in my opinion, are achieved only when you get past the Analysis phase.
A note on statistics: Many of the results presented in the report are based on somewhat small samples, mostly for the personality types. The majority are statistically significant using simple tests. We have tried to specify all the interesting cases where conclusions might not be statistically significant. During our work we have refined many questions in the surveys and are now collecting more data to validate the results and make inference more accurate.
More is yet to come. To keep tabs on future results, just sign-up for an email update from this blog, or follow me on Twitter.
Dear Ron, I am a student from Italy that would like to write his thesis on Startup (lean startup in particularly). My problem is that this "phenomena" is not really spread in my country and so it's impossible to get relevant data. The idea of doing a survey and send it worldwide is very complicate as most of them wouldn't respond or not in time as it's only a poor student asking it. I would like to know if it is possible to get the data on which you made all this wonderful and valuable conclusion. If not, would be nice to get some help on where I could ask/get some valuable and relevant date. Thanks for your help, please contact me on alex.gordiani@gmail.com
This post is different from what I read on most blog. And it have so many valuable things to learn.
I really like this website and hope you will write more. Thanks a lot for your information.
Employee Satisfaction Survey Questions